Concept mapping is a visual aid that students create through identifying relationships between and among important concepts. Concept mapping is an effective way to creatively engage students in the learning process when introducing new topics, hard-to-grasp ideas, or needing students to expand their knowledge on a previously learned subject.
Teaching and Learning Goal
My goals for using concept mapping are to:
- Assess students’ understanding of course materials;
- Understand where students need additional support.
My goals for my students completing a concept map are to:
- Remember important concepts from the readings; basic recall to identify concepts (can be done as a class, in small groups, or individually).
- Engage in higher-order thinking by making associations and assigning relationships between and among concepts.
- Create maps that visually arrange concepts in a meaningful ‘big picture’ way.
Activity and Results
In this case example of concept mapping (Novak, 2010), I wanted to provide students with an alternative to the typical ‘read and respond’ sorts of in-class and homework assignments; my overarching teaching goal is to apply a ‘Universal Design for Learning’ (UDL) approach to my classroom (meaning that my pedagogical approach has multiple means of engagement, representation, and action; Rose & Meyer, 2002). However, I quickly realized that to provide a UDL platform, I needed to model activities through scaffolded exercises as otherwise, students do not understand the objectives or how to complete the assignment. Thus, the first time I assign concept mapping, we do it together in a live lecture. Moving forward in the semester, I offer concept mapping as an option for submitting certain homework assignments.
There are multiple ways to complete a concept map, which can vary significantly in the level of detail and design. The main steps include students first listing key terms or concepts related to the assigned topic. This topic could be the required readings from homework or perhaps the focus of a research paper. After listing out essential concepts, students then arrange these concepts on a whiteboard in a way that makes sense to them (in the Adobe Connect classroom). Students may also use a piece of paper, or if completed as a homework assignment, utilize a free version of a digital whiteboard for a more stunning visual effect (e.g., JamBoard, Lucidchart). An important final step for students is to identify and detail the links between concepts (e.g., is part of, connected by, consists of, between, defined, needs, requires, includes, etc.) as they all eventually relate to the main/assigned topic.
After viewing students’ completed concept maps, it is like a view into their thinking processes. I can quickly ascertain where they are making strong connections with the course material and when additional support is needed. Additionally, this activity provides great motivation for students to complete the assigned readings before coming to class so that they can engage in the learning activity in a meaningful way.
Barriers that I have encountered are the wildly different degrees of detail and complexity in their maps. That is why scaffolding this activity is helpful so that together as a class, students can first learn from one another about what are important concepts from the readings, for example, and how to describe relationships among concepts. Another thing that I learned when assigning this as homework is to allow students a week to revise their maps with the additional information they learn from the lecture. Students are often quite pleased with the connections they make, and the visual appeal of their maps, especially when it comes to hard-to-grasp theories or ideas. Allowing students to share their maps in small groups or be posted in Canvas for others to comment on, is rewarding for all involved.
Technical Details and Steps
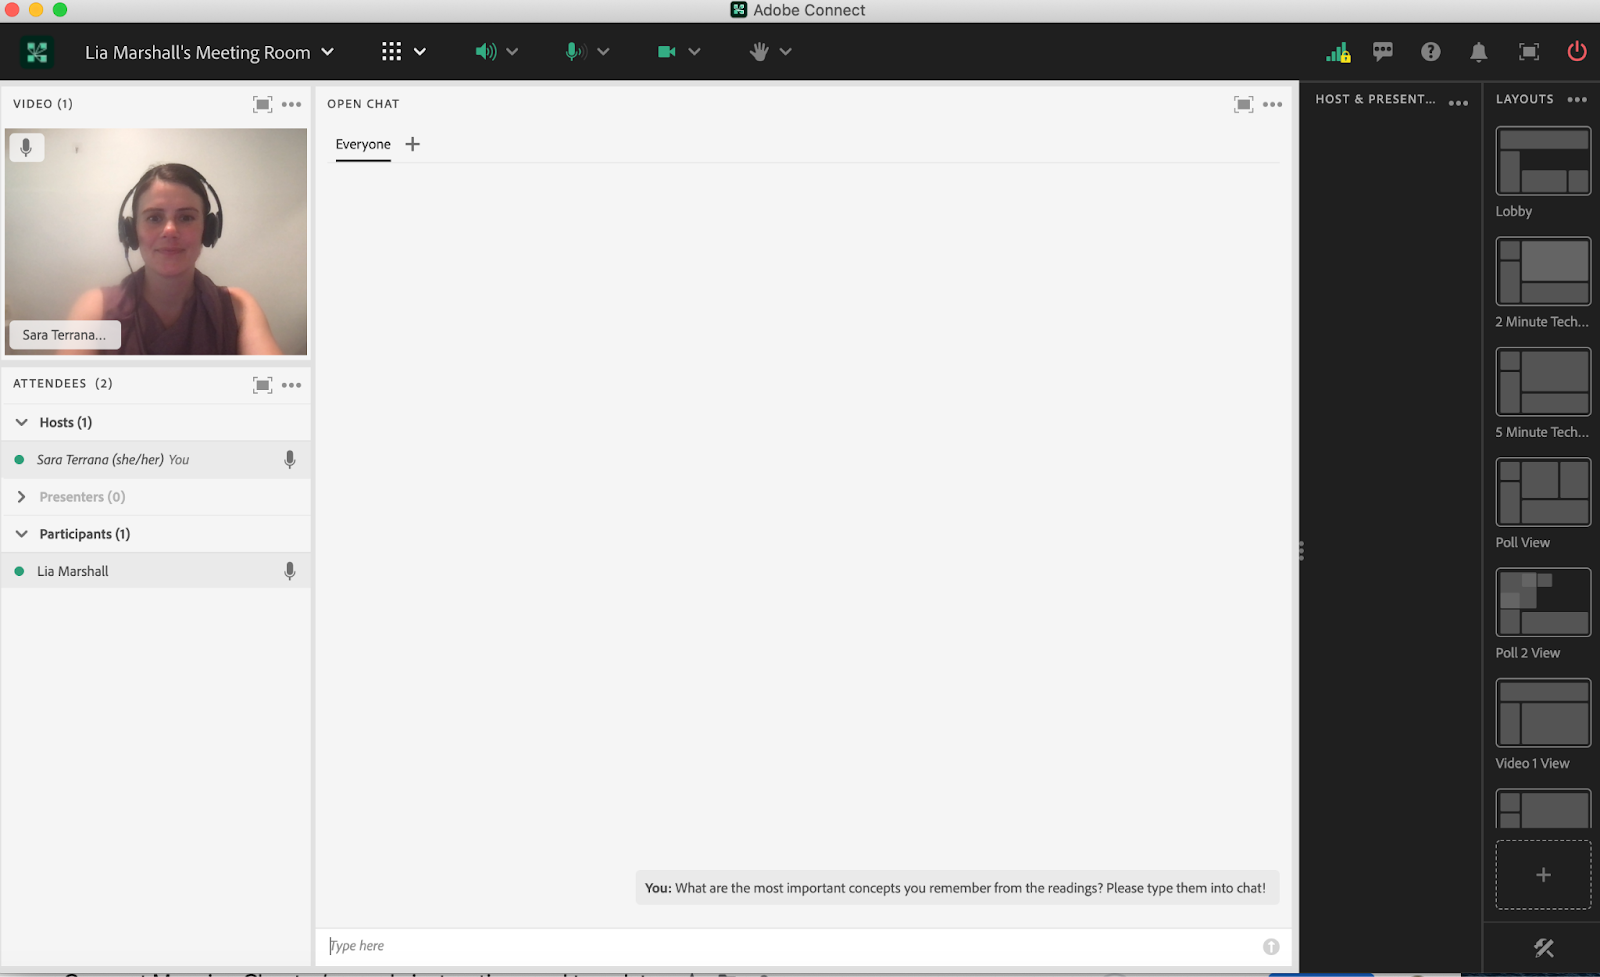
Step 1: First, I set up the layout with a large chat pod to view more replies at once (Image 1). I ask students to recall essential concepts from topic x (e.g., the assigned readings or what the topic is for that week). Initially, there might be a lag, but as students start typing in relevant concepts, I typically acknowledge them and keep probing for more until the list is at least 25+ important concepts. Notably, the concepts that students list may not be what you deem noteworthy, and that is okay; the point here is messy brainstorming. This is modeling to the students just to get ideas written down.
Step 2: Next, I verbally explain that now with this long list of concepts related to topic x, the work is to make connections between them on the whiteboard using connectors such as: is part of, connected by, consists of, between, defined, needs, requires, includes, etc.
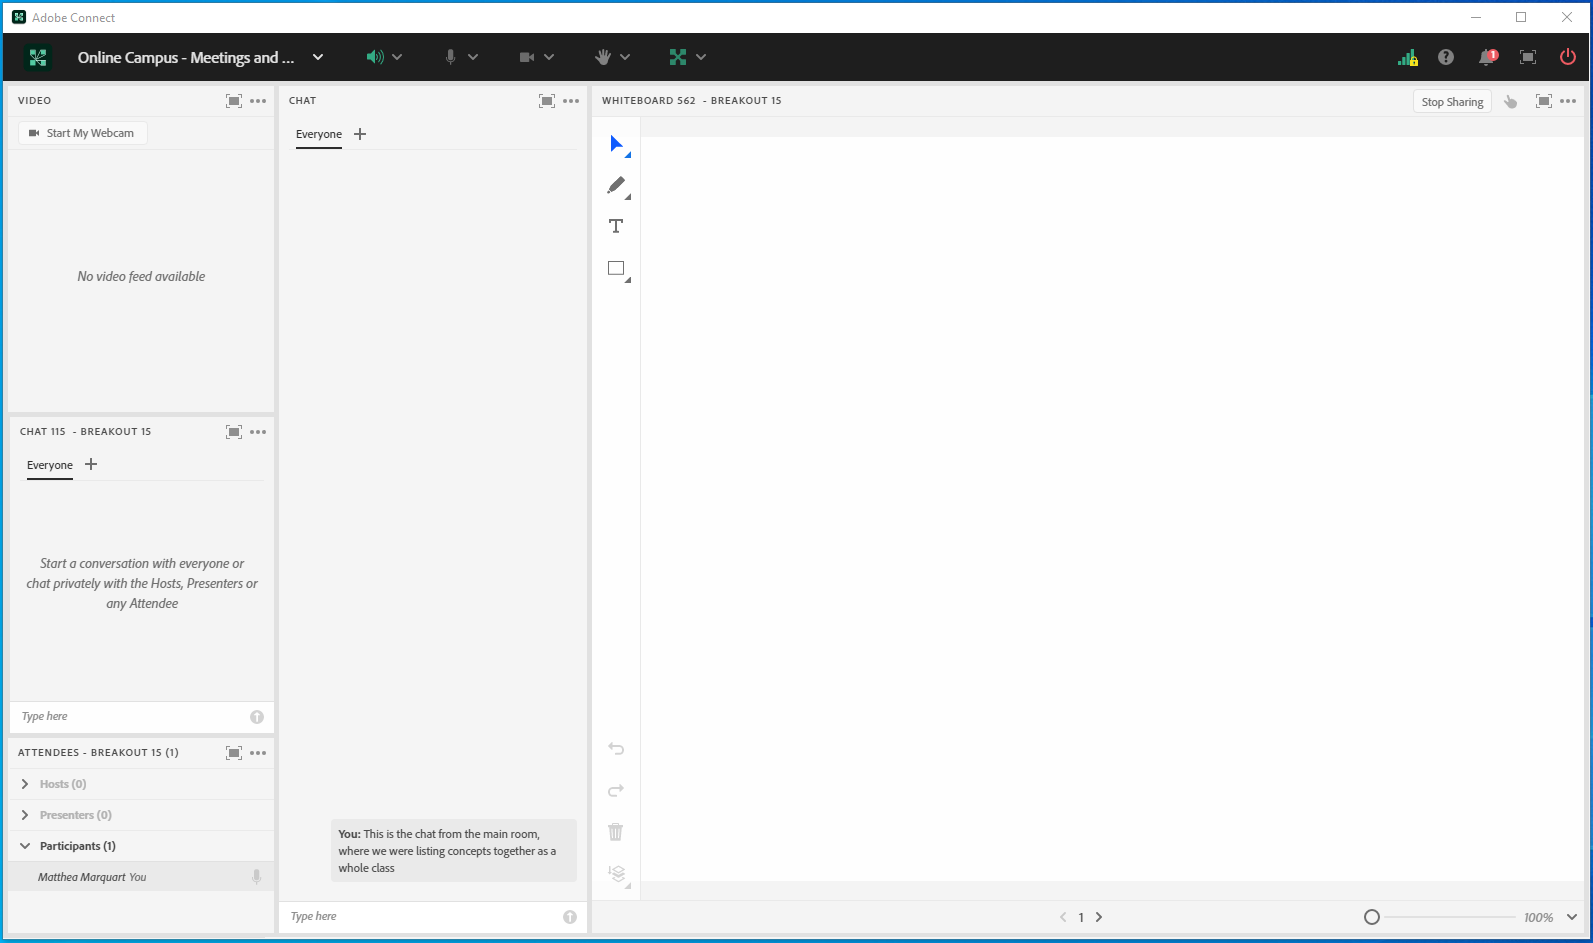
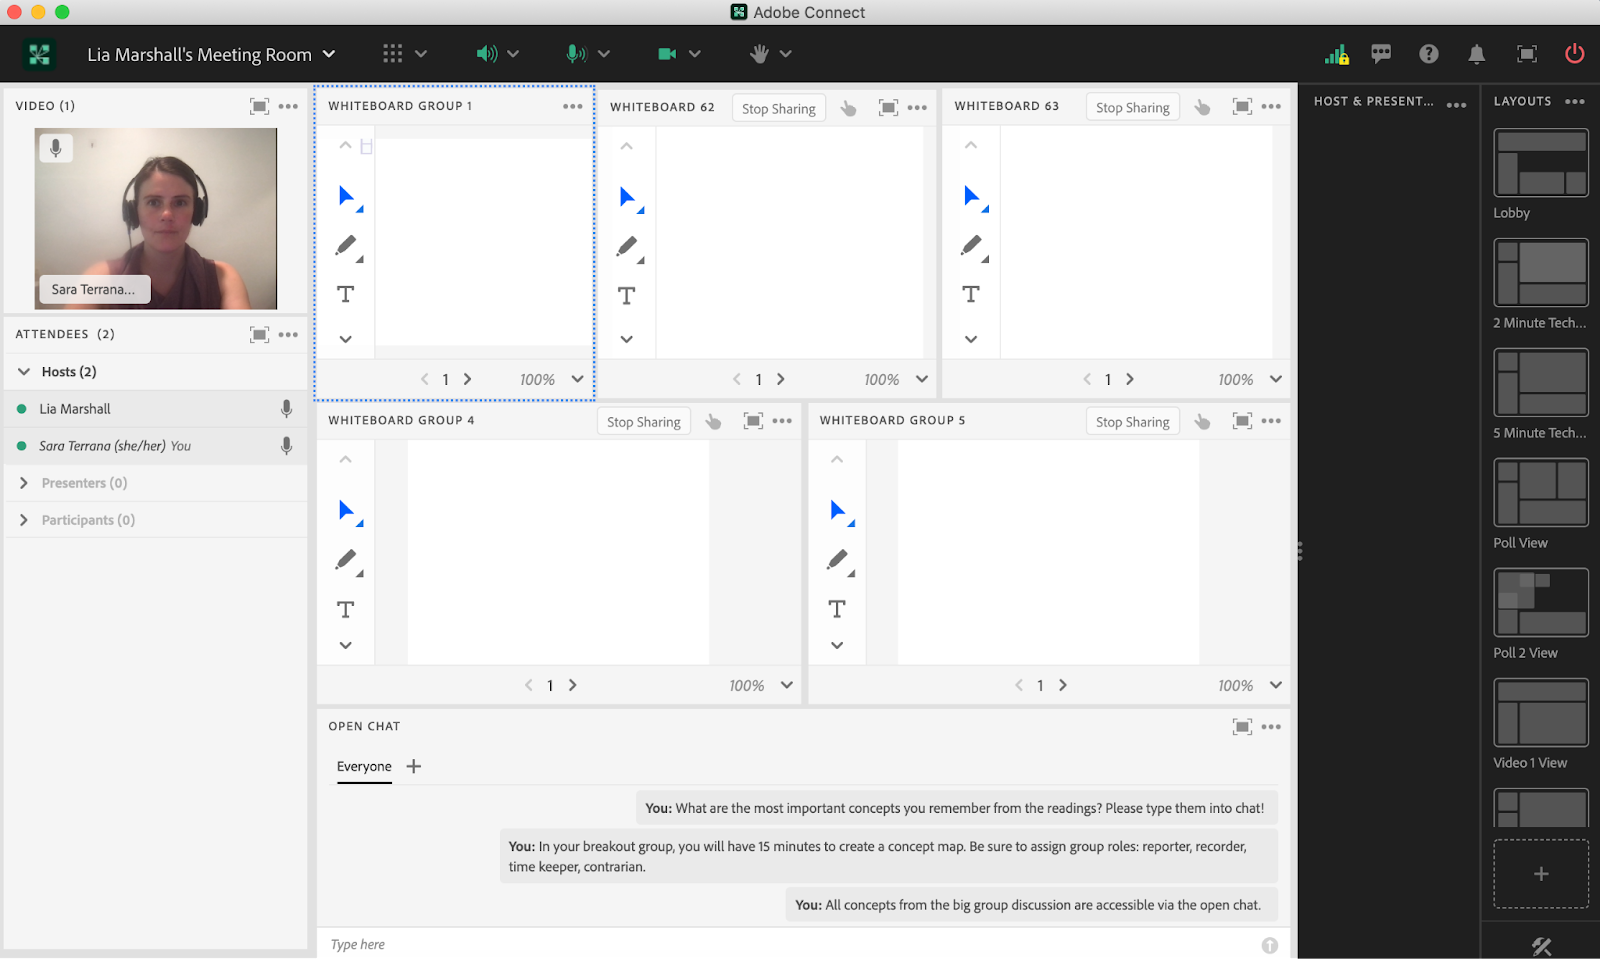
Step 3: I put students into breakout groups of about four students to create their first concept map (Image 2). Anytime I put students into small groups, I make sure there are roles assigned (e.g., in alphabetical order, recorder, contrarian, time-keeper, reporter). When they are in their small groups, they work together with the list of concepts generated from the large group (but are free to add in additional concepts) to create a map that identifies and explains links among the concepts, including defining key terms if necessary. Notably, the layout of this breakout room includes the chat from the main group so that students have access to all of the concepts that the class generated. It is the role of the recorder (note-taker) to use the whiteboard and create the map. Importantly, all group members provide input regarding what they think the connections are between and among the various concepts. The role of the contrarian is pivotal here as they push the boundaries by disrupting ‘group think’ regardless of their personal views. The time-keeper ensures the group stays on task while the reporter reports back to the main group. While students are in breakout groups, I am in the main room taking a birds-eye view of their group work so that I can send out broadcast messages when needed or enter the rooms of groups who are struggling (Image 3). I give students about 15 minutes in their groups to create their map.
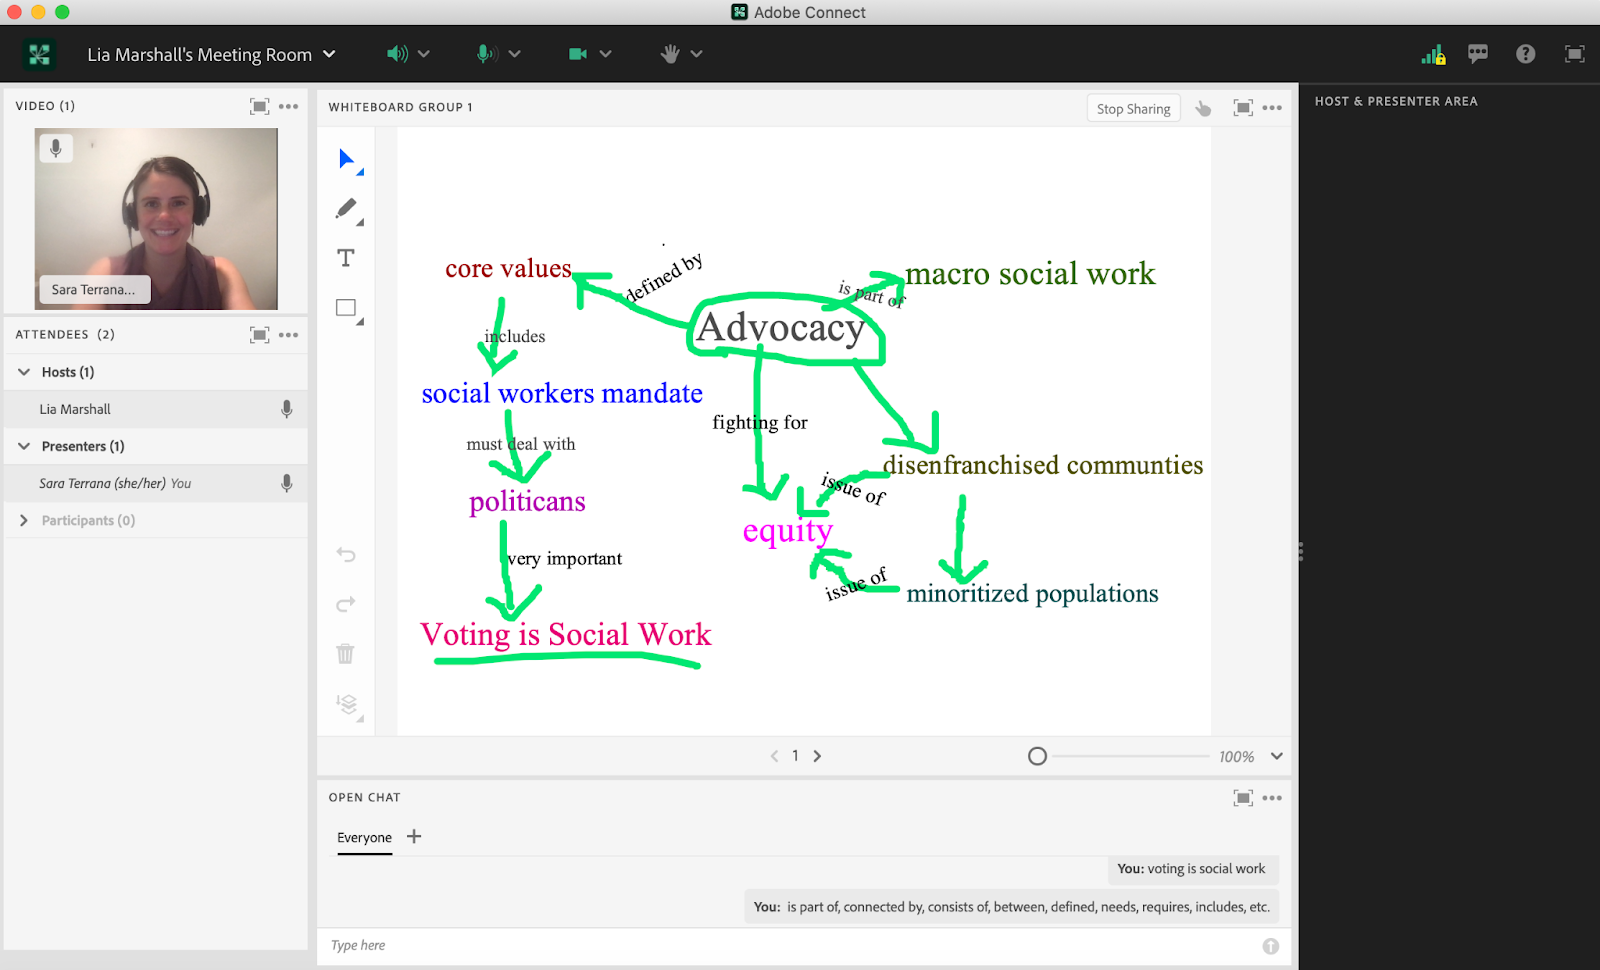
Step 4: I then take about 10 minutes of class time to have each group’s reporter report back to the main group in one minute explaining the highlights of their map. I set up the Adobe classroom with a video pod that shows one speaker, minimizes the chat, and makes the focus of the layout the large whiteboard (Image 4). During this time, students note the different levels of complexity and visual detail of the various maps by posting encouraging comments in the chat. As the instructor, I aim to highlight the content and substance of the maps’ connections.
The entire activity takes approximately 30 minutes of class time. Through this type of scaffolding experience, students become knowledgeable and comfortable submitting their assignments in this manner for future assignments. For example, later in the semester, I may have a video or book chapters as assigned homework along with a prompt they need to answer. For the response, students could upload a concept map, post a VoiceThread reaction, or respond with a traditional written response. The main point is that they have reflected upon and engaged with the material, then followed their learning path to show what they now know as part of a UDL approach.
What this looked like in Adobe Connect
Image 1: This screengrab shows a large format chat pod with the instructor’s video minimized in the upper left corner and attendees listed below the video pod while the majority of the screen is the open chat box. The attendees' section shows Lia Marshall as an example student; notably, she is not an actual student but rather a colleague helping with the screengrab. To the right is the presenter-only area, which is not visible to students. Adobe product screenshot(s) reprinted with permission from Adobe.
Image 1 Alt-Text: This image shows a large format chat layout. There are three sections viewable to students and two sections on the right side viewable only to the instructor. On the very left side of the screen, making up approximately 20% of the screen are two sections. In the upper left corner is the instructor’s video. Below the video pod is a narrow section that has all of the attendees. In this example, there is the host (instructor) and participants (e.g., students; in this example, Lia Marshall is listed as an example student but she is not an actual student). About two-thirds of the screen is the open chat. I have typed in the prompt in this example, “What are the most important concepts you remember from the readings? Please type them into chat!” Approximately 10% of the right side of the screen is hidden from students and has a place for host & presenter notes and shows the links to different layouts.

Image 2: This screengrab shows the layout for the breakout groups from a student’s view. The whiteboard takes up about 60% of the screen while the rest of the screen has the main group’s chat (so that students can access all of the concepts generated in the first brainstorming discussion) and a separate breakout room chat, videos, and the attendees' list. The section shows Matthea Marquart as a sample student; she is not an actual student but rather a colleague helping out with the screengrab. Adobe product screenshot(s) reprinted with permission from Adobe.
Image 2 Alt-Text: This screengrab is what the student's view would be in their breakout room. There are three main sections divided vertically. The left side section one, approximately 20% of the screen, has a space for student videos, which is currently empty except for a small ‘start my webcam’ button on the upper left corner. Directly below the video space is a chat box for the specific breakout group, which is currently void of chat except for the standard message “start a conversation with everyone or chat privately with the Hosts, Presenters, or any Attendee.” Below that in the lower left-hand corner is the attendees' list where one participant is listed, Matthea Marquart (she is not an actual student). In the second section, also approximately 20% of the screen, is one tall vertical rectangular box that is the full height of the layout, which is the main group chat. The message in the chat box states: “This is the chat from the main room, where we were listing concepts together as a whole class.” The third section, approximately 60% of the screen, is the group’s whiteboard, which is currently empty.

Image 3: When students are in their respective breakout rooms I take a birds-eye view of the class. This means that while students are working in their groups, I can monitor their whiteboards in real time. The attendees' section shows Lia Marshall as an example student; notably, she is not an actual student but rather a colleague helping with the screengrab. Adobe product screenshot(s) reprinted with permission from Adobe.
Image 3 Alt-Text: This screengrab shows a birds-eye view of the breakout rooms. The screen is divided into five sections. On the left side, there is a narrow column with two sections. The first is a small square video pod of the instructor, and the second section is the list of attendees directly below the video pod. Lia Marshall is listed as an example student in the attendees' section; she is not an actual student. In the center of the screen, the largest section shows five different breakout groups’ whiteboards. In this example, the whiteboards are empty. Below this section is the open chat where I have typed in three messages. The first message says “What are the most important concepts you remember from the readings? Please type them into chat!” The second message says “In your breakout group, you will have 15 minutes to create a concept map. Be sure to assign group roles: reporter, record, timekeeper, contrarian.” The third message says “All concepts from the big group discussion are accessible via the open chat.” On the right side, a narrow column that is hidden from student view has a place for notes to the host and presenter and next to that are links to various other layouts that have been set up in this room.

Image 4: Here, the Adobe classroom layout reflects one student speaker (i.e., reporter) on camera presenting their group’s concept map. The chat is minimized but included so that their peers can type in encouraging comments. Adobe product screenshot(s) reprinted with permission from Adobe.
Image 4 Alt-Text: The layout of this screengrab shows one example student (Sara Terrana) presenting their group’s concept map on a whiteboard. The example student is not an actual student but the chapter author. The chat at the bottom has two entries including “voting is social work” and a list of ways to connect concepts: “is part of, connected by, consists of, between, defined, needs, requires, includes, etc.” The narrow column on the right-hand side of the screen is hidden from students and shows the host and presenter area which is currently left blank. The left side column is about 20% of the screen and includes a video of the student presenting, with the list of attendees below. About 50% of the screen is the group’s concept map. This map, as an example, has the topic “advocacy” in the center with a green circle around it. There are four arrows pointing out from the main topic. The first arrow is labeled ‘defined by’ and is pointing to the words “core values.” Underneath “core values” is another arrow that is labeled ‘includes’ and the term “social workers mandate.” Under that is an arrow labeled ‘must deal with’ then the term “politicians.” Under politicians is a final arrow, labeled ‘very important’ and the concept of “voting is social work” is underlined. So this path illustrates that Advocacy is defined by core values, and the core values include a mandate for social workers to advocate. In order to do this, social workers must deal with politicians, and it is very important that social workers advocate around voting. Moving clockwise from the main concept of advocacy, the second arrow is labeled ‘is part of’ and the term “macro social work.” This path illustrates that advocacy is part of macro social work. The third arrow is pointing to the concept of “disenfranchised communities.” Underneath that is an arrow pointing to “minoritized populations.” These two main concepts, disenfranchised communities, and minoritized populations have two arrows labeled ‘issues of’ that are pointing to the term “equity.” The fourth arrow states ‘fighting for’ and points to “equity” as well. These two paths on the map illustrate that advocacy for disenfranchised communities, including minoritized populations, is an issue of equity, and that advocacy involves fighting for equity.

Acknowledgments
I would like to thank Dr. Lia Marshall for her incredible patience and assistance in the screen grab process and Matthea Marquart for her continued support and mentorship in my online teaching journey.
References
Novak, J. D. (2010). Learning, creating, and using knowledge: Concept maps as facilitative tools in schools and corporations. Routledge.
Rose, D., & Meyer, A. (2002). Teaching every student in the digital age: Universal Design for Learning. Association for Supervision and Curriculum Development.