 Watch on Vimeo
Tool Snapshot
| Price | Free |
|---|
| Learning | Cognitive Constructivism |
|---|
| Ease of Use | ★★★★✩ |
|---|
| Privacy | ★★★★★ |
|---|
| Accessibility | ★★★★★ |
|---|
| Class Size | Unlimited |
|---|
| ISTE*S | Knowledge Constructor & Computational Thinker |
|---|
Type of learning: Students learn to analyze and construct meaning from data.
Privacy: The Data Basic website stores information uploaded for only the amount of time it takes users to analyze the data, then it is deleted. The aggregate results shown (metadata) are kept for 60 days, and then get deleted.
Ease of Use: Tool has simple and easy-to-use interface.
Accessibility: Data Basic supports screen readers.
Power and Bias: Website is available for English, Spanish, and Portuguese speakers.
ISTE Standards for Students: Hands-on approaches to analyzing data. Students construct their knowledge through collecting data and trying to find stories and information within it.
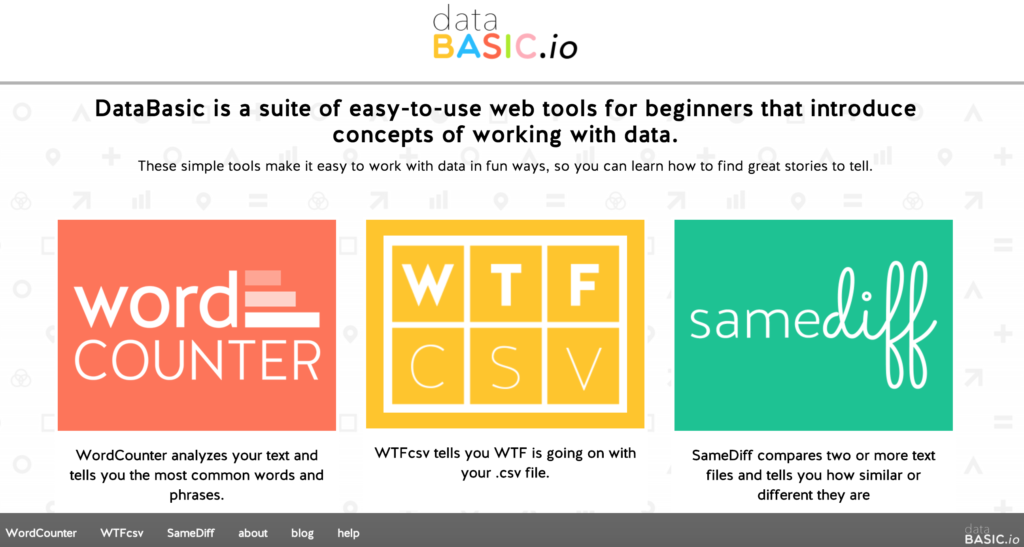
 Main page of the website databasic.io
DataBasic.io Overview Video

 Watch on YouTube
Data Basic & the SAMR Model
Dr. Ruben Puentedura’s SAMR model offers a lens for examining how technology is adopted in a classroom. As you strive to incorporate online tools into your classroom, we encourage you to use this model as an analytic tool.
Here is an example of how Data Basic might fit within the SAMR model:
- Substitution: Students upload a dataset to WTFcsv to get a series of visual charts rather than designing their own charts on paper in class.
- Augmentation: Word Counter instantly generates word clouds and bi-/trigrams of most popular words in a text, which provides students with a new way to analyze textual data.
- Modification: Using Samediff, students can instantly compare and contrast two different text documents.
- Redefinition: Students can make hypotheses about textual data and get immediate results to confirm or reject their hypotheses.
Far too often, technology is used as a direct substitute for other low-tech tools (e.g., pencil and paper). While substitution has some benefits (e.g., students develop their technology skills and knowledge), we encourage you to think about how you might use Twitter to modify or redefine learning.
Learning Activities
WordCounter Activity Guide: Use WordCounter to analyze a musician’s lyrics and sketch a story with their words. Sketching a data story helps participants build their data literacy by finding and drawing a story about what words show up in famous musicians’ lyrics.
WTFcsv Activity Guide: Use WTFcsv to identify some questions to ask your spreadsheet. This hands-on activity helps participants build their data literacy while looking at some fun datasets and brainstorming questions you can ask about them.
SameDiff Activity Guide: Write Your Own Song Use SameDiff to analyze the lyrical styles of two musicians and invent a duet for them.
Lesson Ideas Using WordCounter
Personal Narratives
Write, or copy and paste, a personal narrative into WordCounter. Students will be able to see common themes from the visuals that are produced from the Data Basic WordCounter’s word clouds, Top Words, Bigrams, and Trigrams. These word clouds make great displays for a classroom bulletin board.
Current Affairs Analysis
Copy and paste a news story into Data Basic WordCounter. Ask students to guess what the story was about and generate a headline based on the results.
Student Profiles
Have all students in your class write a few positive adjectives about each of their classmates anonymously. Compile all the papers, input the adjectives for each student into WordCounter, and generate a student profile word cloud to give back to the student.
Collaborative Group Work
For the solar system, student teams could each be responsible for creating Word Clouds to describe one of the eight planets or in a Math class student teams could be responsible for creating a visual representation listing all the types of quadrilaterals.
Lesson Ideas Using SameDiff
Compare and Contrast: Compare and contrast the documents of two or more students’ writing, famous speeches, song lyrics, news reports, or book reviews.
How to Use DataBasic
- Go to databasic.io
- Click one of the three tools: Word Counter, WTFcsv or SameDiff
- Word Counter: You can use any sample from drop down menu, paste a url, paste a text or upload your own file. Hit Count button to get started .
- WTFcsv : You can use an existing sample file from the drop down menu or upload your own file. Hit Analyze button to continue exploring.
- SameDiff : You can use an existing sample file from the drop down menu or upload your own files/speeches. Hit Compare button to continue exploring. You can go back and forth between each of data basic tool by clicking on the menu at the bottom.
Research
D'Ignazio, C., & Bhargava, R. (2016). DataBasic: Design principles, tools and activities for data literacy learners. The Journal of Community Informatics, 12(3).
D'Ignazio, C. (2017). Creative data literacy: Bridging the gap between the data-haves and data-have nots. Information Design Journal, 23(1), 6-18.