A potential reason for conducting survey research is to measure change. Quite often researchers want to be able to determine whether any change can be attributed to a specific intervention, but they might also simply be interested in identifying a change in general (not attributed to any specific causal relation).
Measuring change usually requires that we have two measures of the variable in question for each of the individuals responding to the survey. Change is calculated by determining the difference between the paired values. This typically means administering two surveys (i.e., pre and post surveys each providing a measure of the variable). It is best practice to use the same individuals for the pre and post surveys; however, in some cases, different groups of individuals might be surveyed if the samples are randomly selected representative samples of the population. Change, in this case, can be determined by comparing the average difference obtained from each survey. In some cases, a single survey (posttest only) might attempt to determine change by asking respondents to report the amount of change they experienced or by asking respondents to report pre and post levels of the variable in question.
Reporting Amount of Change
When data is interval or ratio level (scale data) the mean differences can be reported. However, in many cases, the data obtained in a survey is best described as ordinal data and should be reported as proportions or frequencies.
Consider the situation where you ask respondents about their level of interest in a topic (pre and post). You might speculate (or hope) that after receiving instruction, those involved might become more interested in the topic. In this case, the data you obtain is not interval-level data because the data points are not equidistant. We can still provide descriptive information about the change that occurred, as well as inferential evidence regarding the statistical significance and magnitude of the change.
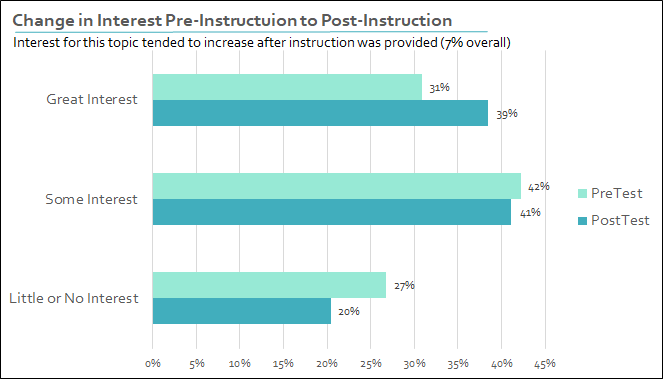
Reporting average percentages by response categories, we see that in general there was a 7% increase in interest post-instruction. Using inferential statistics, you would be able to determine the statistical significance (probability that this result was due to chance) and the practical significance (whether the magnitude of the change was substantial). A chi-square goodness of fit test could be used for a pre-post comparison using the posttest results as observed values and the pretest results as expected values. Remember that it is best practice to also report the sample size and response rates.

Reporting Breakdown of Change
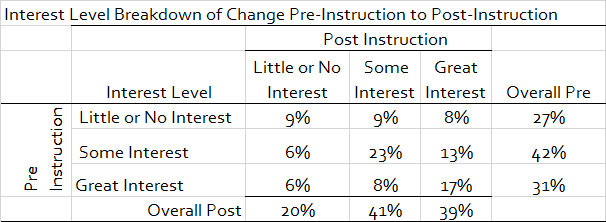
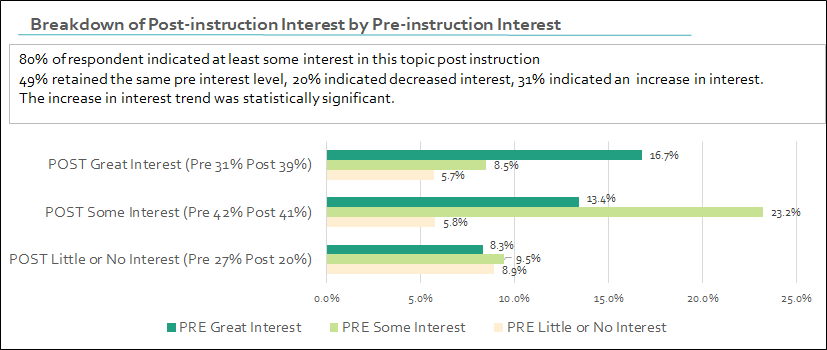
In this example, reporting overall change in interest can be a bit misleading. You might erroneously conclude that the change in interest was all positive. This is not the case. While the aggregate change has a positive trend, many individuals actually reported a decrease in interest after instruction. This change is not represented in the previous analysis. A more complete analysis would report the breakdown of the change, which includes the magnitude and direction.
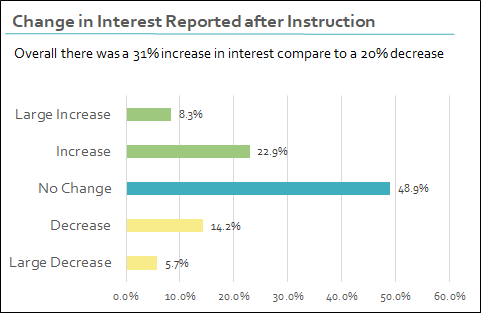
Based on this analysis, while there was an overall increase in interest, 31% of respondents reported an increase in interest, and 20% of the respondents reported a decrease in interest. Nonparametric inferential statistics (e.g., a McNemar-Bowker test of symmetry) could be used to determine the statistical significance of the result.
Posttest Only Example
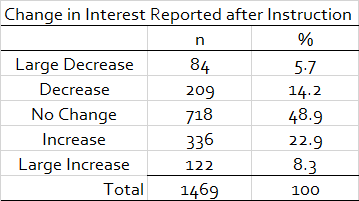
While this result may best be obtained using pre and posttest surveys, at times this is not possible. You may only be able to ask respondents (in a posttest-only survey) to indicate any change in interest they believe occurred after receiving instruction.
Discussion Questions
- What are the benefits and limitations of measuring change using data from match pairs, representative samples, or posttest-only, single-sample data?